Right Bet Size: Why Over/Under Size Betting Destroys Growth
The Right Bet Size: why “a bit more” than Kelly eats your profit (and “too little” steals years of growth).
Short version: If you bet even slightly above Full Kelly, your long-run growth rate falls. Push it much higher and it turns negative—your bankroll shrinks even on +EV odds. Full Kelly isn’t ideal for most people either: even a small error in your win-probability estimate (p) can turn a +EV bet into a long-run disaster. Unless you’re 100% confident in your estimates, never exceed My Optimal (≈ 0.33× Full Kelly). Bet sizing is the key.
This article was prepared for users of TrueBetVision — our web app and bankroll simulator that helps you pick the optimal bet size for your edge and risk tolerance. You can run free simulations (3/day) and compare Custom / My Optimal / Full Kelly on our site.
If you don’t want to wade through formulas: there’s a live example with real screenshots from TrueBetVision. Formulas and detailed theory are in the appendix at the end.
1) Why bet size matters more than it seems
Most bettors feel it intuitively: if a bet is +EV (you have an edge), a bigger stake = faster bankroll growth. That’s partly true — up to a point. Beyond a certain peak, each extra bit of stake slows growth, and past another point your long-run growth turns negative. That peak is the Kelly maximum.
Important: undershooting a bit is better than overshooting a bit.
At the same time, betting too small also hurts: you systemically under-monetize your edge, growth is too slow, and you lose years of potential compounding.
Important: overly cautious sizing is costly, too — you “pay” by not earning (especially at 0.1–0.2× Kelly on +EV bets).
All math (formulas and general comparisons) is in the Appendix — Theory & Comparisons below. First, real cases.
2) A real example — NAVI vs Astralis, Bo3, CS2, BLAST Bounty 2025 Season 2
- Initial bankroll: $1,000
- Odds format: Decimal (American shown too)
- Odds: 1.58 Decimal or −172 American
- Estimated win probability (p): 69%
- Sequential bets with these parameters: 100
- Simulated bankroll paths: 10,000
- Betting modes:
- Custom = 1% of current bankroll
- My Optimal (author’s optimum for these parameters)
- Full Kelly = 15.55% (f* = (b·p − (1 − p)) / b = 0.1555)
Screenshot 1 — simulation settings.
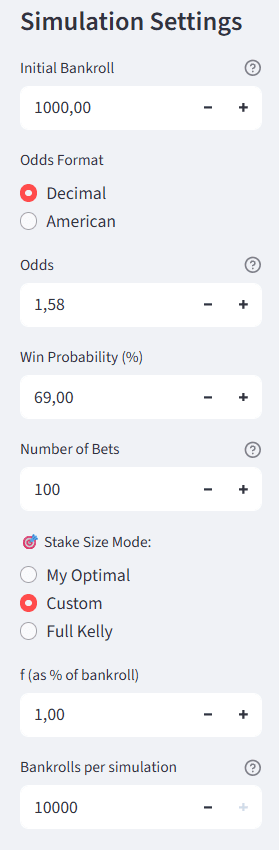
First, let’s look at a pro bettor being too cautious and betting too small. Initial bankroll is $1,000. Using my models, I estimate NAVI’s win probability at 69%. The price I found is extremely favorable: −172 (American) / 1.58 (Decimal). Pros can see this is juicy even at a glance. But how much should you stake?

Under typical outcomes (neither hot nor ice-cold), the median bankroll after 100 bets is $1,091.42 — that’s +$91.42. Not bad. If luck runs a bit cold, the 33% worst-case is $1,057.40 — still +$57.40. With a serious cold streak, the 10% worst-case is $992.51 — −$7.49 from the start.
- Custom 1%: Median $1,091.42 · 33% worst-case $1,057.40 · 10% worst-case $992.51
- My Optimal: Median $1,477.96 · 33% worst-case $1,254.36 · 10% worst-case $903.54
- Full Kelly (15.55%): Median $2,052.30 · 33% worst-case $1,231.43 · 10% worst-case $443.35
My Optimal offers strong typical upside with manageable tail risk. Full Kelly has the highest median but brutal worst-case outcomes: at the 10% worst-case you’re at $443.35 (−$556.65).


Plainly: the more certain you are in your p-estimates, the closer you may get to Full Kelly — but never exceed it.
P.S. My real choice: I staked 13% of the bank (Full Kelly = 15.55%) because I was very confident in my numbers and fully aware of the risks. I don’t recommend this without many years of modeling and thousands of bets’ worth of experience.
3) A case of oversizing (tilt, 40%)
Bad day, then you spot a very +EV bet (same example: −172 / 1.58 at p = 69%). You want to “win it back” now. Not all-in, not even half — let’s say 40% of bankroll. What happens over 100 such bets?


You can feel the story best on the time-series chart: extreme over-betting self-destructs, even on a strong +EV edge.
Here’s how the bet size and bankroll development would look at My Optimal (screenshot 8) and at Full Kelly (screenshot 9):


4) Common bet-sizing mistakes
- Misplaced priorities. Hunting edge while ignoring sizing. In practice, sizing dictates how much of that edge you actually monetize.
- Over Kelly “because I’m confident”. After the maximum, the growth curve drops fast.
- Perma-cautious 0.1–0.2× Kelly “just in case”. Fine temporarily or with unstable models, but as a long-term strategy it costs years of growth.
- Mismatched odds/events. Different b, different variance, correlation across bets — optimal f changes.
- Over-estimating p. Kelly is sensitive to p-errors. If you’re not sure about model quality, use Fractional Kelly (0.33× or 0.5×) and verify with simulations.
5) TL;DR — takeaways from the live cases
- Don’t exceed My Optimal (~0.33× Full Kelly) unless you’re 100% sure about p. Even Full Kelly punishes p-errors.
- The price of “1% flat”. In the 69% @ 1.58, 100-bet case: median $1,091.42 vs $1,477.96 (My Optimal) vs $2,052.30 (Full Kelly). Lost vs Full Kelly: $960.88; vs My Optimal: $386.54.
- Full Kelly risks are real. 10% worst-case: $443.35 (−$556.65 from $1,000).
- Tilt-bet 40% = self-destruction. Median ~$237.04, 33% worst-case $56.22, 10% worst-case $3.16.
- Simulate before scaling. Run 10,000 paths in TrueBetVision and look at both median and the worst-case outcomes (10% / 33%).
6) Appendix — Theory & Comparisons
A) Kelly Criterion (theory)
Kelly picks the bankroll fraction f (stake as a share of current bankroll) that maximizes expected log growth per bet:
G(f) = p · ln(1 + b·f) + (1 − p) · ln(1 − f)
where: O — decimal odds; b = O − 1 — net odds; p — win probability, q = 1 − p; f — stake fraction.
Maximum for a binary bet: f* = (b·p − q) / b. Check for 1.58 @ 69%: b = 0.58 → f* ≈ 0.1555 ⇒ 15.55%.
B) Comparison 1: edge 55% @ odds 2.20 (b = 1.20)
| Share of Kelly | Actual f | Expected growth / bet | % per bet |
|---|---|---|---|
| 0.10× K | 0.0175 | 0.00349 | +0.35% |
| 0.50× K | 0.0875 | 0.01371 | +1.38% |
| 1.00× K | 0.1750 | 0.01827 | +1.84% (max) |
| 1.20× K | 0.2100 | 0.01753 | +1.77% (~−4% vs max) |
| 1.50× K | 0.2625 | 0.01359 | +1.37% (~−26% vs max) |
| 2.00× K | 0.3500 | −0.00099 | −0.10% (shrinks) |
C) Comparison 2: small edge 52.5% @ odds 2.00 (b = 1)
Here Full Kelly = 5% of bankroll.
| Share of Kelly | Actual f | Expected growth / bet | % per bet |
|---|---|---|---|
| 0.50× K | 0.025 | 0.00094 | +0.094% |
| 1.00× K | 0.050 | 0.00125 | +0.125% (max) |
| 1.20× K | 0.060 | 0.00120 | +0.120% (below max) |
| 2.00× K | 0.100 | −0.00001 | ≈ 0% / negative |
7) Call to action
Run your own simulations in TrueBetVision: enter bankroll, odds, and your p estimate; compare Custom / My Optimal / Full Kelly; examine the median and the worst-case outcomes (10% / 33%). You’ll see the real cost of over- and under-betting for your parameters.
Subscribe to TrueOddsBet on Telegram for calculations, examples, and app updates.